This post briefly summarizes our work on relational and analogical visual reasoning. For further details, please refer to our CVPR 2019 paper.
1. Introduction
The study of vision must therefore include not only the study of how to extract from images …, but also an inquiry into the nature of the internal representations by which we capture this information and thus make it available as a basis for decisions about our thoughts and actions. — David Marr, 1982, Vision
Computer vision has a wide spectrum of tasks. Some computer vision problems are clearly purely visual, “capturing” the visual information process; for instance, filters in early vision, primal sketch as the intermediate representation, and Gestalt laws as the perceptual organization. In contrast, some other vision problems have trivialized requirements for perceiving the image, but engage more generalized problem-solving in terms of relational and/or analogical visual reasoning. In such cases, the vision component becomes the “basis for decisions about our thoughts and actions”.
Currently, the majority of the computer vision tasks focus on “capturing” the visual information process; few lines of work focus on the later part—the relational and/or analogical visual reasoning. One existing line of work in equipping artificial systems with reasoning ability hovers around Visual Question Answering (VQA). However, the reasoning skills required in VQA lie only at the periphery of the cognitive ability test circle [1]. To push the limit of computer vision or more broadly speaking, Artificial Intelligence (AI), towards the center of cognitive ability test circle, we need a test originally designed for measuring human’s intelligence to challenge, debug, and improve the current artificial systems.
A surprisingly effective ability test of human visual reasoning has been developed and identified as the Raven’s Progressive Matrices (RPM), which is widely accepted and believed to be highly correlated with real intelligence. Unlike VQA, RPM lies directly at the center of human intelligence, is diagnostic of abstract and structural reasoning ability, and characterizes the defining feature of high-level intelligence, i.e., fluid intelligence.
To push the limit of current vision systems’ reasoning ability, we generate a new dataset to promote further research in this area. We refer to this dataset as the Relational and Analogical Visual rEasoNing dataset (RAVEN) in homage to John Raven for the pioneering work in the creation of the original RPM. In summary:
- RAVEN consists of 1,120,000 images and 70,000 RPM problems, equally distributed in 7 distinct figure configurations.
- Each problem has 16 tree-structure annotations, totaling up to 1,120,000 structural labels in the entire dataset.
- We design 5 rule-governing attributes and 2 noise attributes. Each rule-governing attribute goes over one of 4 rules, and objects in the same component share the same set of rules, making in total 440,000 rule annotations and an average of 6.29 rules per problem.
Compared to a previous paper also on RPM [2], our dataset includes full annotations with structure information and a diverse set of figure configurations that directly attack current models’ compositional reasoning ability.
2. Creating RAVEN
Our work is built on prior work aforementioned. We implement all relations in Advanced Raven’s Progressive Matrices identified by Carpenter et. al. [1] and generate the answer set following the monotonicity of RPM’s constraints proposed by Wang and Su [3].
Figure 1 shows the major components of the generation process. Specifically, we use the Attributed Stochastic Image Grammar (A-SIG) as the representation of RPM; each RPM is a parse tree that instantiates from the A-SIG. After rules are sampled, we prune the grammar to make sure the relations could be applied on any sentence sampled from it. We then sample a sentence from the pruned grammar, where rules are applied to produce a valid row. Repeating such a process three times yields a problem matrix. To generate the answer set, we modify attributes on the correct answer such that the relationships are broken. Finally, the structured presentation is fed into a rendering engine to generate images. See the supplementary material for production rules, semantic meanings of rules and nodes, and more examples.
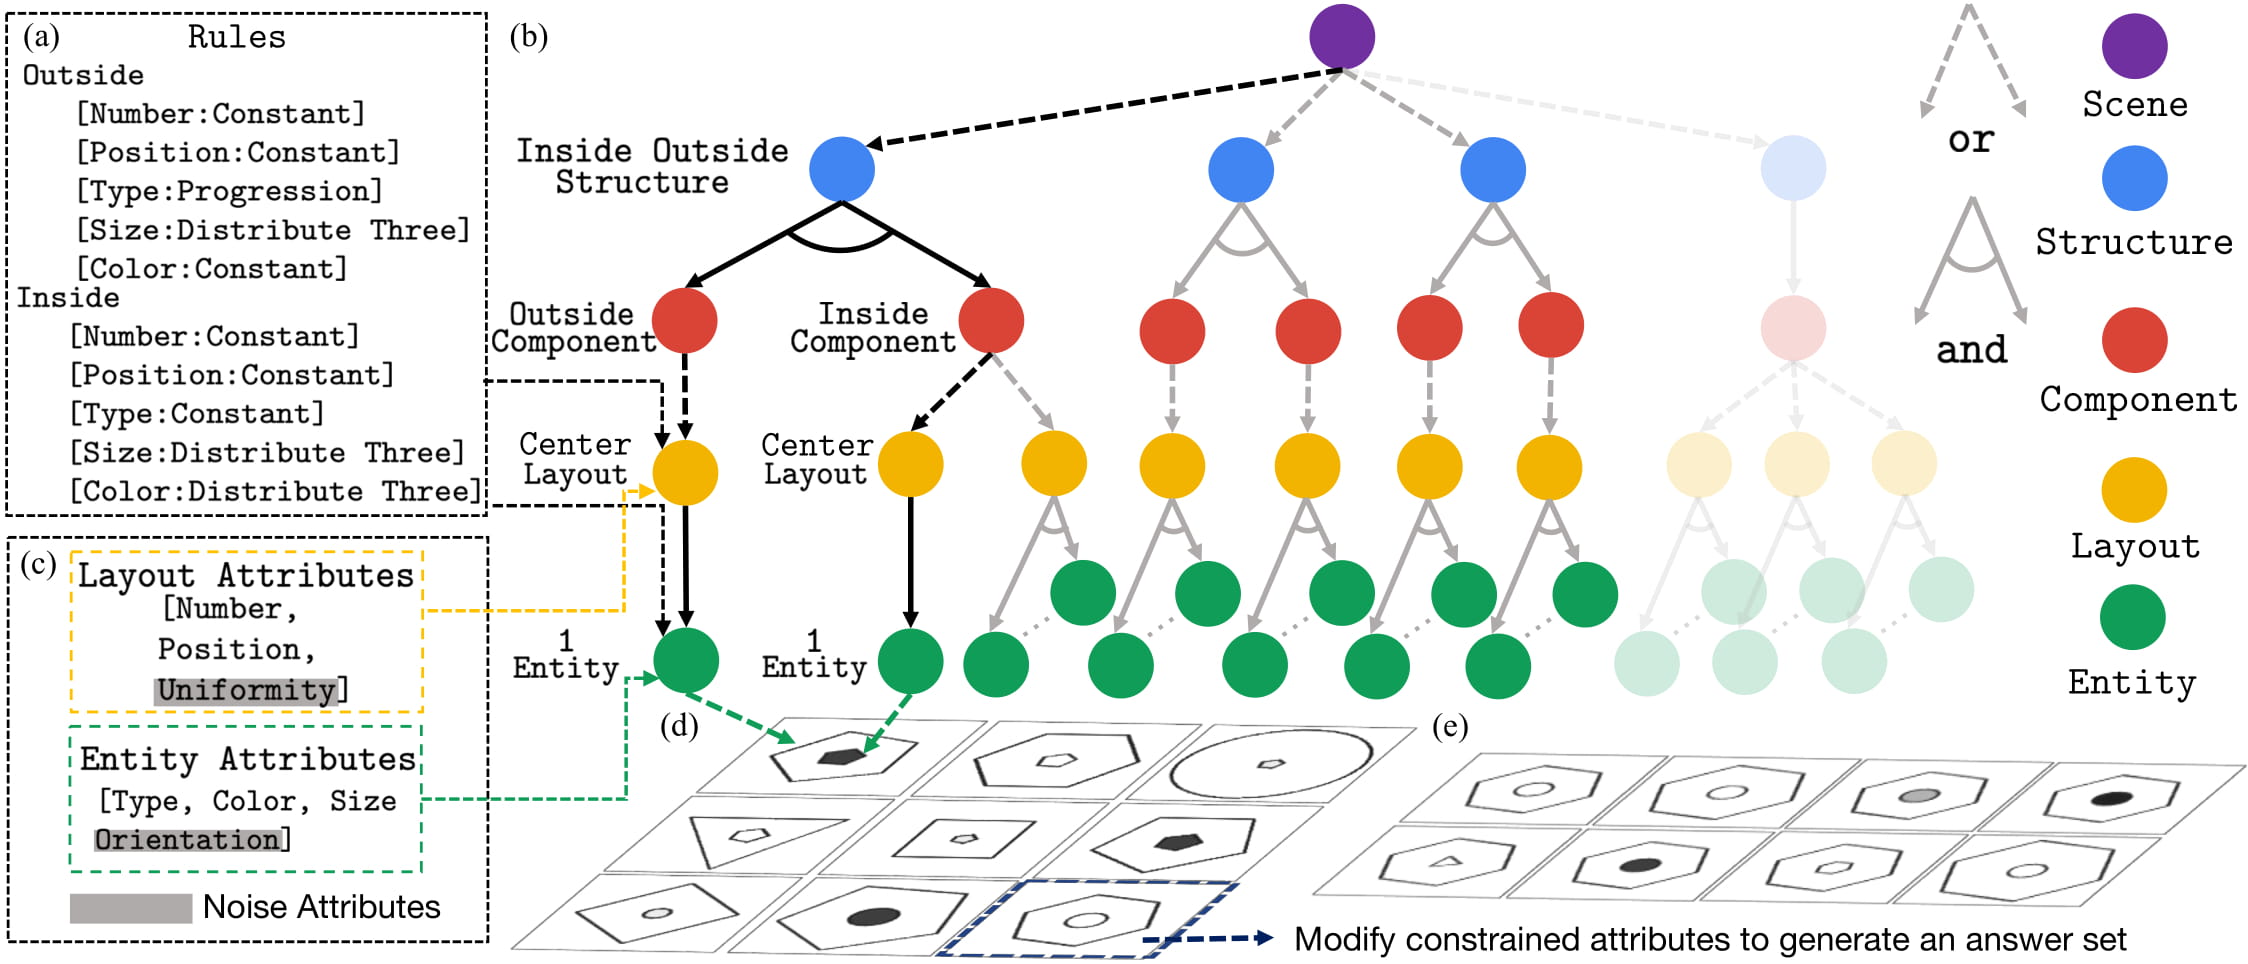 Figure 1. RAVEN creation process. A graphical illustration of the grammar production rules used in A-SIG is shown in (b). Note that Layout and Entity have associated attributes (c). Given a randomly sampled rule combination (a), we first prune the grammar tree (the transparent branch is pruned). We then sample an image structure together with the values of the attributes from (b), denoted by black, and apply the rule set (a) to generate a single row. Repeating the process three times yields the entire problem matrix in (d). (e) Finally, we sample constrained attributes and vary them in the correct answer to break the rules and obtain the candidate answer set.
To increase the challenges and difficulties in the RAVEN dataset, we append 2 types of noise attributes—Uniformity and Orientation. Uniformity, set false, will not constrain Entities in a Layout to look the same, while Orientation allows an Entity to self-rotate.
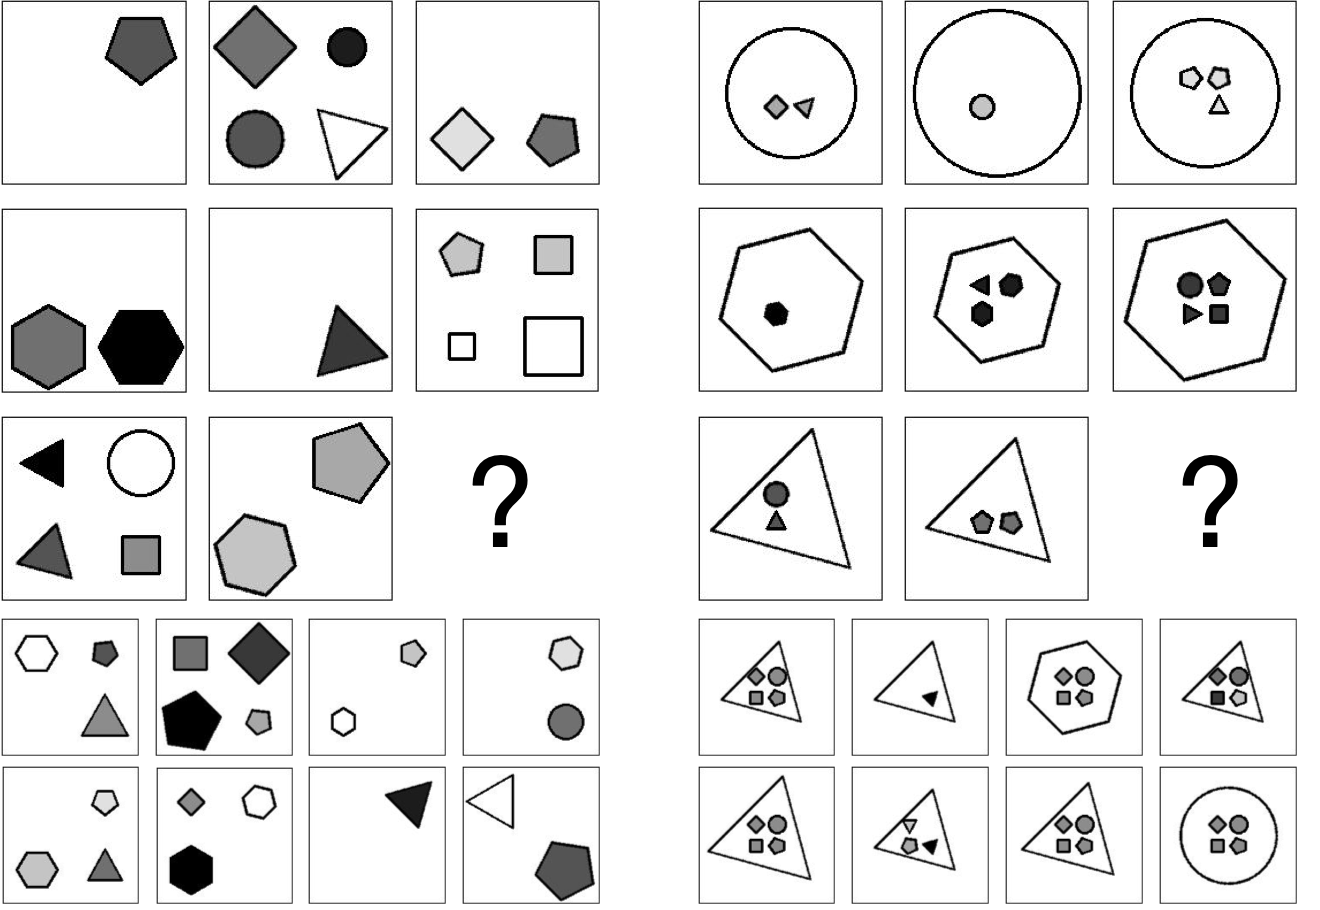 Figure 2. Examples of RPM that show the effects of adding noise attributes. (Left) Position, Type, Size, and Color could vary freely as long as Number follows the rule. (Right) Position and Type in the inside group could vary freely.
3. Comparison with PGM [2]
The table below summarizes several essential metrics of RAVEN and PGM. Although PGM is larger than RAVEN in terms of size, it is very limited in the average number of rules (AvgRule), rule instantiations (RuleIns), number of structures (Struct), and figure configurations (FigConfig). This contrast in PGM’s gigantic size and limited diversity might disguise model fitting as a misleading reasoning ability, which is unlikely to generalize to other scenarios. As shown below a distinctive feature of RAVEN is the introduction of the structural representation of the image space (StructAnno). We also conducted a serious human study (HumanPerf) on RAVEN.
| PGM | RAVEN (Ours) | |
|---|---|---|
| AvgRule | 1.37 | 6.29 |
| RuleIns | 5 | 8 |
| Struct | 1 | 4 |
| FigConfig | 3 | 7 |
| StructAnno | 0 | 1,120,000 |
| HumanPerf | ✔ |
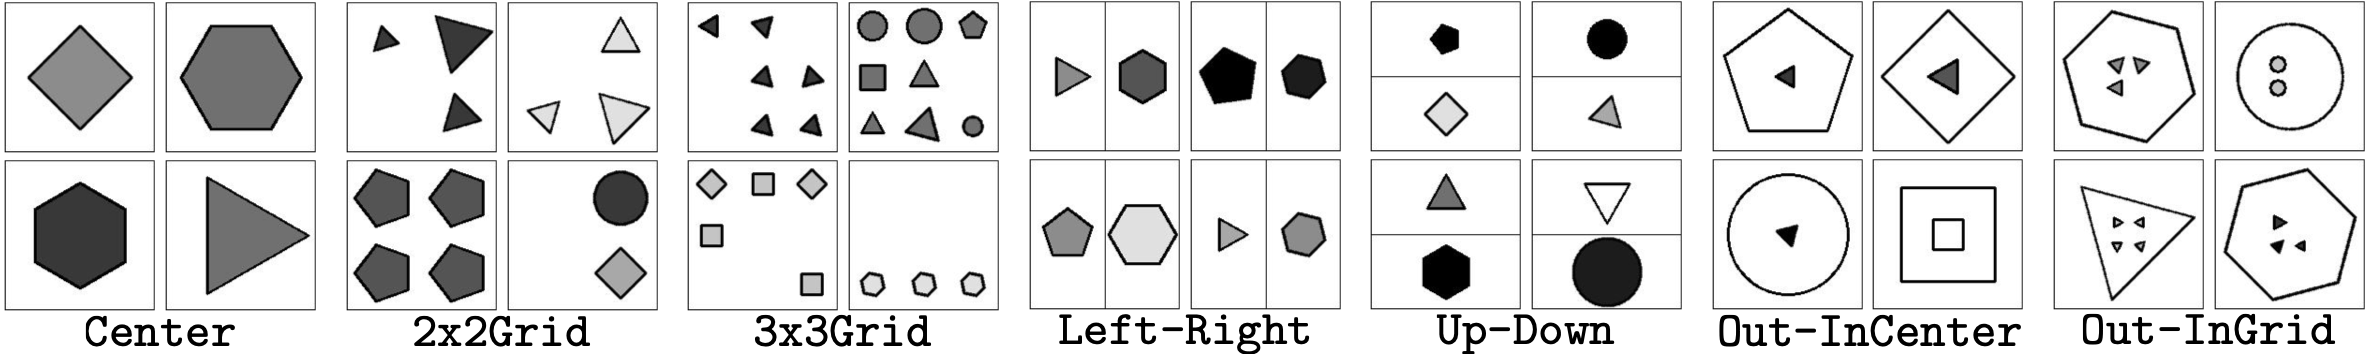 Figure 3. A peek view into the 7 figure configurations.
4. Dynamic Residual Tree for RPM
To capture the structure information inherent in this problem and further improve the model performance on RPM, we propose a simple tree-structure neural module called Dynamic Residual Tree (DRT) that operates on the joint space of image understanding and structure reasoning. An example of DRT is shown below.
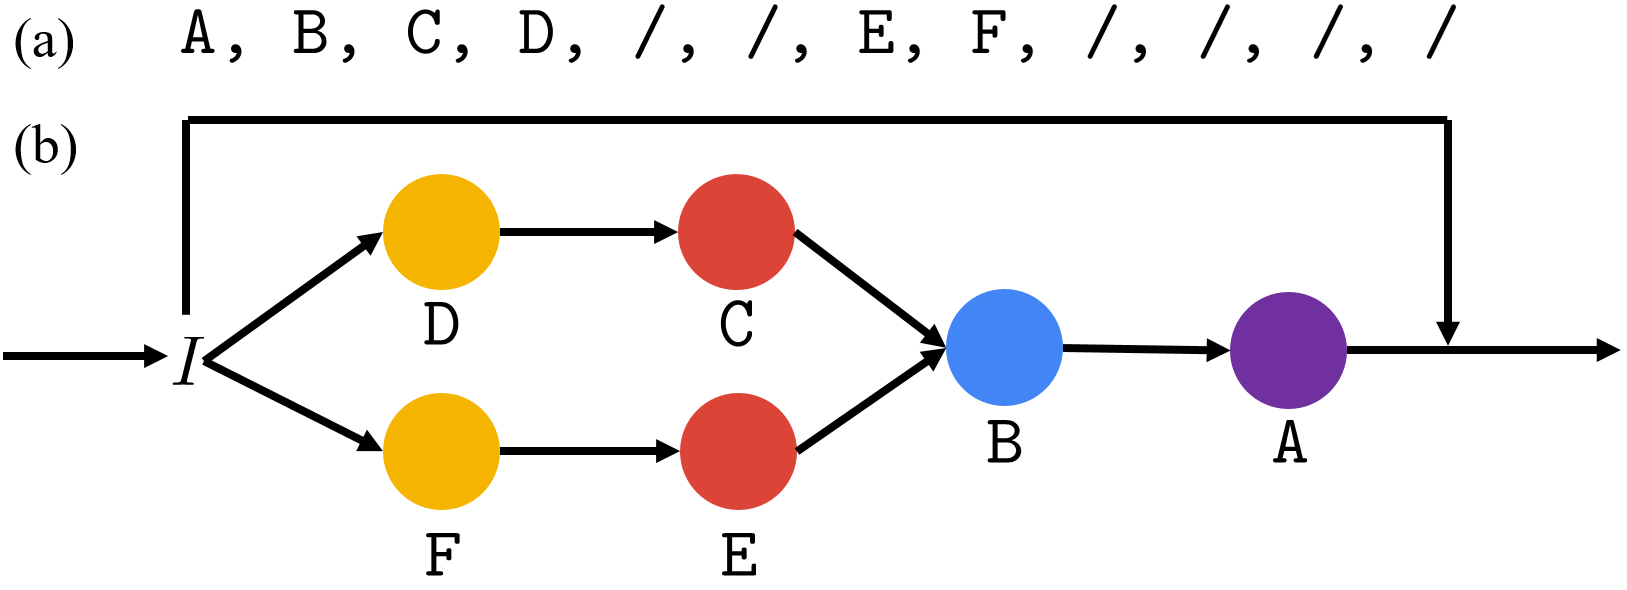 Figure 4. An example computation graph of DRT. (a) Given the serialized n-ary tree representation (pre-order traversal with / denoting end-of-branch), (b) a tree-structured computation graph is dynamically built. The input features are wired from bottom-up following the tree structure. The final output is the sum with the input, forming a residual module.
CNN features from the lower layers are fed into the leaf nodes of DRT, gradually updated through AND nodes and OR nodes from bottom-up following the tree structure, and output to higher-level layers. Inspired by ResNet, we make DRT a residual module by adding the input and output of DRT together, hence the name Dynamic Residual Tree (DRT).
5. Experiments
| Method | Acc | Center | 2x2Grid | 3x3Grid | L-R | U-D | O-IC | O-IG |
|---|---|---|---|---|---|---|---|---|
| LSTM | 13.07% | 13.19% | 14.13% | 13.69% | 12.84% | 12.35% | 12.15% | 12.99% |
| WReN | 14.69% | 13.09% | 28.62% | 28.27% | 7.49% | 6.34% | 8.38% | 10.56% |
| CNN | 36.97% | 33.58% | 30.30% | 33.53% | 39.43% | 41.26% | 43.20% | 37.54% |
| ResNet | 53.43% | 52.82% | 41.86% | 44.29% | 58.77% | 60.16% | 63.19% | 53.12% |
| LSTM+DRT | 13.96% | 14.29% | 15.08% | 14.09% | 13.79% | 13.24% | 13.99% | 13.29% |
| WReN+DRT | 15.02% | 15.38% | 23.26% | 29.51% | 6.99% | 8.43% | 8.93% | 12.35% |
| CNN+DRT | 39.42% | 37.30% | 30.06% | 34.57% | 45.49% | 45.54% | 45.93% | 37.54% |
| ResNet+DRT | 59.56% | 58.08% | 46.53% | 50.40% | 65.82% | 67.11% | 69.09% | 60.11% |
| Human | 84.41% | 95.45% | 81.82% | 79.55% | 86.36% | 81.81% | 86.36% | 81.81% |
| Solver | 100% | 100% | 100% | 100% | 100% | 100% | 100% | 100% |
L-R denotes Left-Right, U-D Up-Dowm, O-IC Out-InCenter, and O-IG Out-InGrid.
The above table shows the benchmarking results, where we measure accuracy of 4 computational models and their DRT extensions against human and a heuristics solver.
In terms of model performance, a counter-intuitive result is: computer vision systems do not achieve the best accuracy across all other configurations in the seemingly easiest figure configuration for human subjects (Center). We further realize that the LSTM model and the WReN model perform only slightly better than random guess (12.5%). Such results contradicting to [2] might be attributed to the diverse figure configurations in RAVEN. Unlike LSTM whose accuracy across different configurations is more or less uniform, WReN achieves higher accuracy on configurations consisting of multiple randomly distributed objects (2x2Grid and 3x3Grid), with drastically degrading performance in configurations consisting of independent image components. This suggests WReN is biased to grid-like configurations (majority of PGM) but not others that require compositional reasoning (as in RAVEN). In contrast, a simple CNN model with MLP doubles the performance of WReN on RAVEN, with a tripled performance if the backbone is ResNet.
We observe a consistent performance improvement across different models after incorporating DRT, suggesting the effectiveness of the structure information in this visual reasoning problem. While the performance boost is only marginal in LSTM and WReN, we notice a marked accuracy increase in the CNN- and ResNet-based models (6.63% and 16.58% relative increase respectively). However, the performance gap between artificial vision systems and humans are still significant (up to 37% in 2x2Grid), calling for further research to bridge the gap.
6. Conclusion
The entire work leaves us many mysteries. Humans seem to apply a combination of the top-down and bottom-up method in solving RPM. How could we incorporate this into a model? What is the correct way of formulating visual reasoning? Is it model fitting? Is deep learning the ultimate way to visual reasoning? If not, how could we revise the models? If yes, how could we improve the models?
We hope these unresolved questions would call for attention into this challenging problem.
If you find the paper helpful, please cite us.
@inproceedings{zhang2019raven,
    title={RAVEN: A Dataset for Relational and Analogical Visual rEasoNing},
    author={Zhang, Chi and Gao, Feng and Jia, Baoxiong and Zhu, Yixin and Zhu, Song-Chun},
    booktitle={Proceedings of the IEEE Conference on Computer Vision and Pattern Recognition (CVPR)},
    year={2019}
}
References
[1] Carpenter, Patricia A., Marcel A. Just, and Peter Shell. “What one intelligence test measures: a theoretical account of the processing in the Raven Progressive Matrices Test.” Psychological review 97.3 (1990): 404.
[2] Barrett, David, et al. “Measuring abstract reasoning in neural networks.” International Conference on Machine Learning. 2018.
[3] Wang, Ke, and Zhendong Su. “Automatic Generation of Raven’s Progressive Matrices.” Twenty-Fourth International Joint Conference on Artificial Intelligence. 2015.
-
Previous
MetaStyle: Trading Off Speed, Flexibility, and Quality in Neural Style Transfer -
Next
Learning Perceptual Inference by Contrasting